Financial Review FY2025
>> View Financial Statement FY2025
>> View Financial Archive
>> View Financial Statement FY2025
>> View Financial Archive
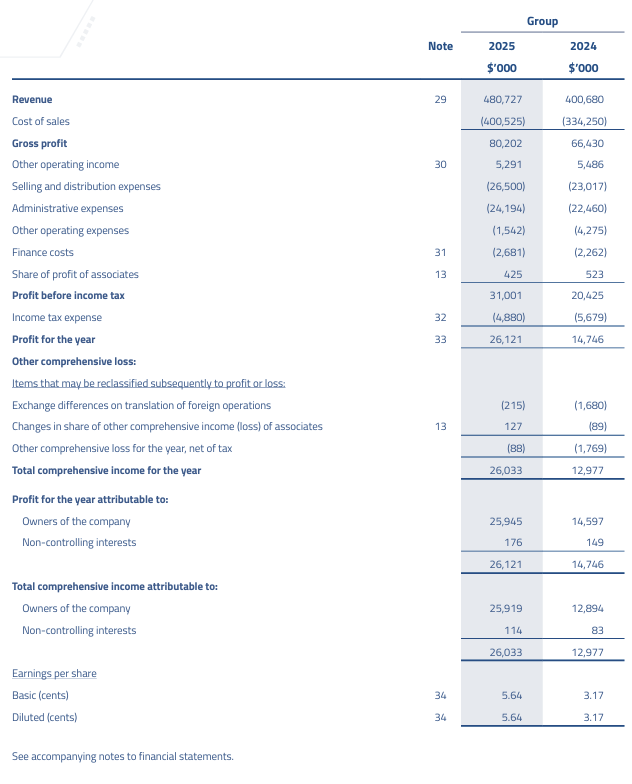
Revenue
For the six months ended 30 June 2025 (“2H25”), the Group reported revenue of $245.632 million, an increase of 19.86% from $204.935 million in the corresponding period ended 30 June 2024 (“2H24”). Growth was recorded in the Cable & Wire (“C&W”) Segment and Electrical Material Distribution (“EMD”) Segment, mainly driven by the expanding economy in the Southeast Asia region.
For the financial year ended 30 June 2025 (“FY2025”), the Group’s revenue increased by 19.98%, an increase of $80.047 million from $400.680 million in the last financial year (“FY2024”) to $480.727 million in the current financial year. Growth was recorded across all of the Group’s segments, except the Switchboard Segment.
The C&W Segment achieved revenue of $340.151 million, an increase of 25.35% or $68.800 million, compared to $271.351 million in FY2024. The increase was broad-based across Singapore, Malaysia, and Vietnam. In Singapore, growth was supported by higher demand from public sector construction activities and data centre developments. In Malaysia, revenue improved on the back of both private and public sector construction activities as well as higher exports to the Philippines. In Vietnam, growth was mainly attributable to increased public sector construction activities and higher exports to Cambodia.
The EMD Segment registered revenue of $107.498 million, an increase of $12.434 million, or 13.08%, compared to $95.064 million in FY2024. The growth was primarily driven by revenue contributed by the newly acquired Indonesian subsidiary, which also supported higher export sales. Additional contributions came from the expansion of data centre activities in Malaysia. Revenue improvement were also recorded in the Chemical, Oil & Gas (“COG”) Cluster, Marine (“MAR”) Cluster, and Electronics (“ELN”) Cluster, driven by the stronger demand in these sectors.
Revenue from the Test & Inspection (“T&I”) Segment rose marginally by 0.77% or $288,000, from $29.711 million in FY2024 to $29.939 million in FY2025. The increase was mainly due to higher Heat Treatment activities, as more jobs were undertaken for ongoing projects in Indonesia. Laboratory testing services also recorded better performance following a higher volume of business construction activities in Singapore. However, the increase was partially offset by lower contributions from Non-Destructive Testing activities following the completion of most sizeable projects and reduced job volumes in both Indonesia and Singapore.
The Switchboard Segment recorded revenue of $3.139 million in FY2025, a decline of 31.07% from $4.554 million in FY2024, due to fewer government projects secured in Brunei.
Gross Profit
Gross profit (“GP”) increased by $4.743 million from $34.121 million in 2H24 to $ 38.864 million in 2H25. Despite the increase in GP, the gross profit margin (“GPM”) decreased from 16.65% in 2H24 to 15.82% in 2H25. The decrease in GPM was mainly attributable to lower margins from the C&W segment due to fluctuations in copper prices, as well as from the EMD segment, arising from inventories written off and additional allowance for inventories obsolescence.
The Group’s GP for FY2025 increased by 20.73% to $80.202 million from $66.430 million in FY2024. The GPM improved marginally from 16.58% in FY2024 to 16.68% in FY2025, in line with the growth in revenue.
Other operating income
Other operating income for 2H25 decreased by $728,000 from $2.691 million in 2H24 to $1.963 million in 2H25.
For FY2025, the Group recorded other operating income of $5.291 million, a decrease of $195,000 compared to $5.486 million in FY2024. The decrease was primarily attributable to lower scrap sales and lower foreign exchange gain, arising mainly from fluctuations in the US Dollar. However, this was partially offset by the gain on disposal of a subsidiary of $2.199 million.
Selling and distribution expenses
Selling and distribution expenses for 2H25 increased by $2.430 million or 21.47% compared to 2H24. For FY2025, selling and distribution expenses increased by $3.483 million, up 15.13% compared to FY2024. This was mainly due to selling and distribution expenses contributed by the newly acquired subsidiary, Elmecon, and higher business operation costs and staff costs which were in line with the higher revenue reported during the current financial year.
Administrative expenses
Administrative expenses for 2H25 increased by $919,000, up 7.84% compared to 2H24. For FY2025, administrative expenses increased by $1.734 million, up 7.72% compared to FY2024. The increase was mainly due to higher staff costs and increased information technology-related expenses to support the Group’s expanding operations.
Other operating expenses
Other operating expenses for 2H25 decreased by $806,000, a 40.24% drop compared to 2H24. In FY2025, other operating expenses decreased by $2.733 million, a 63.93% drop compared to FY2024. The decrease was largely due to the absence of impairment losses recognised in FY2024, which included an impairment loss of $1.430 million on right-of-use assets (“ROUA”) and $893,000 for property, plant and equipment (“PPE”) in Cambodia, as well as a loss allowance of $401,000 for trade receivables. No significant impairment losses were recognised in FY2025.
Finance costs
Finance costs for 2H25 and FY2025 increased by $250,000 and $419,000, respectively, mainly due to higher utilisation of bank borrowings to finance purchase of copper during the current financial period.
Share of profit of associates
The lower share of profit from associates in FY2025 was primarily attributable to decreased sales and profitability reported by an associate, Nylect Group, as well as the reclassification of an associate to a subsidiary following LKHE’s acquisition during the year.
Profit before income tax
The Group’s profit before income tax (“PBT”) increased by $500,000, from $11.012 million in 2H24 to $11.512 million in 2H25, in line with the higher revenue achieved in 2H25.
PBT for FY2025 increased by $10.576 million to $31.001 million in FY2025 from $20.425 million in FY2024. The increase was primarily driven by higher revenue, the gain on disposal of a subsidiary in Cambodia, and the absence of impairment losses on ROUA and PPE that were recognised in FY2024. These factors collectively resulted in the Group’s overall profitability in FY2025.
The C&W Segment’s PBT for FY2025 increased by $7.149 million from $19.314 million to $26.463 million, mainly driven by higher revenue and GP achieved.
The EMD Segment’s PBT for FY2025 declined by $772,000 from $3.138 million to $2.366 million, mainly due to higher operating costs, particularly business operations cost associated with expanding operations in the region, as well as higher staff related expenses.
The T&I Segment reversed its loss before tax of $2.245 million in FY2024 to a profit before tax of $2.059 million in FY2025. The turnaround was primarily attributable to a gain on the disposal of a subsidiary in Cambodia, and the absence of impairment loss on ROUA and PPE that were recognised in FY2024.
PBT from Switchboard Segment decreased by $92,000 or 40.89% compared to FY2024, mainly driven by lower revenue reported.
Income tax expense
Income tax expense for 2H25 and FY2025 decreased by $2.023 million and $799,000 respectively. The decrease was primarily due to the reversal of prior years’ overprovision in income tax and lower deferred tax expense. This was partially offset by higher income tax expense attributable to increased taxable profit for the current financial year. The Group’s effective tax rate for FY2025 was lower compared to FY2024 due to gain on disposal of a subsidiary in Cambodia.
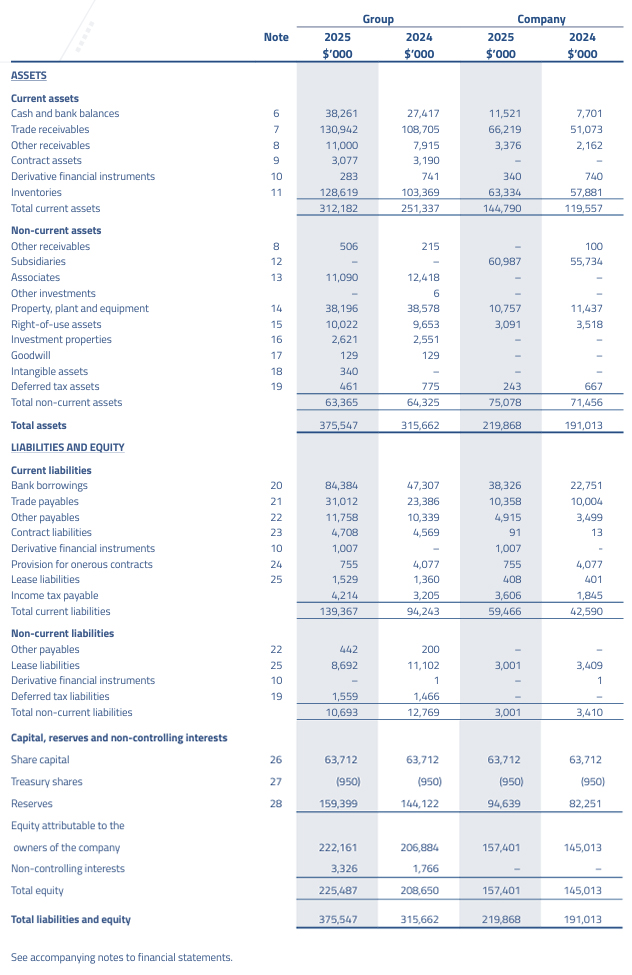
The cash and bank balance increased by $10.844 million due to higher collections from customers, and higher utilisation of bank borrowings towards the end of the current financial year.
Trade receivables increased by $22.237 million due to higher sales towards the end of the current financial year.
Other receivables increased by $3.376 million, primarily due to higher advances paid for purchase of inventories and plant and equipment.
The Group recorded derivative financial instruments (“DFI”) liabilities in FY2025 compared to DFI assets in FY2024. This change was primarily due to fair value losses recognised on forward foreign exchange contracts, arising mainly from the depreciation of the USD towards the end of the financial year.
Inventories increased by $25.250 million, primarily due to higher inventories from the C&W Segment to meet the upcoming delivery demands.
Investment in associates declined by $1.328 million, attributable to the disposal of Astar and the reclassification of Elmecon as a subsidiary of LKHE.
PPE decreased by $382,000 due to depreciation charges of $5.745 million, the disposal and write-off of assets with a net book value of $104,000. The decrease was partially offset by additions of plant and equipment totaling $4.753 million, and assets acquired through acquisition of a subsidiary amounting to $587,000.
The increase in ROUA of $369,000 was mainly due to additions of ROU amounting to $1.910 million, assets acquired through acquisition of a subsidiary amounting to $269,000. The increase was partially offset by depreciation charges of $1.725 million and de-recognition of ROUA with the net book value of $140,000.
Intangible assets rose by $340,000, mainly attributable to distributorship rights and customer relationships recognised from the acquisition of a subsidiary by LKHE.
Deferred tax assets decreased by $314,000, mainly due to timing differences arising from the reversal of provision for onerous contracts during the current financial year.
Bank borrowings increased by $37.077 million, as a result of higher bank borrowings by the C&W Segment for copper purchases.
Trade payables increased by $7.626 million, primarily due to higher purchases by the C&W segment as well as EMD Segment towards the end of the current financial year.
Other payables in total increased by $1.419 million because of higher provision for staff related costs and higher deferred grant income towards the end of the current financial year.
Total lease liabilities decreased by $2.241 million, primarily due to disposal of a subsidiary in Cambodia in the T&I Segment.
The provision for onerous contracts amounted to $755,000, a reduction of $3.322 million from the end of the previous financial year, due to partial delivery of the contracts during the current financial year.
The cash and cash equivalents as at 30 June 2025 increased to $38.261 million compared with $27.417 million at the end of the previous financial year.
The Group’s net cash used in operating activities of $5.126 million was attributable to operating profit before working capital changes, an increase in trade and other receivables, and inventories, as well as payment of income tax. This was partially offset by an increase in trade and other payables, an increase in advances received from customers, and a decrease in contract assets.
The net cash used in investing activities of $4.005 million was mainly for purchase of plant and equipment, acquisition of a subsidiary, net of proceeds from disposal of a subsidiary and an associate, proceeds from disposal of plant and equipment, dividend received from associates and interest received.
The net cash generated from financing activities of $20.023 million was mainly attributable to proceeds from shortterm bank borrowings, net of repayment of bank borrowings, dividends paid, lease liabilities and interest paid.
Looking ahead, there remains significant headwinds in the global economy amidst heightened market volatility compounded by geopolitical uncertainties and evolving trade policies. While global growth is expected to underwhelm, the Group continues to be vigilant and remains nimble to navigate through the difficult business environment.
Notwithstanding these challenges, the Group continues to proactively manage the ongoing price tension arising from the copper price volatility and supply chain constraints.
Moving forward, the Group remains focused on executing its strategy and capturing suitable market opportunities to expand its reach in Southeast Asia. By leveraging robust domestic demand in the region, supported by the digital infrastructure boom and the rapidly developing renewables sector, the Group aims to drive sustainable long-term growth.